How much renewable energy do we use?
Probably less than you think.
(See the "Reading" section below for an audio version of this article.)
"Final energy" is the energy that actually reaches the point of consumption in usable form: electricity at the socket, gasoline or diesel in the tank, or natural gas in a boiler.
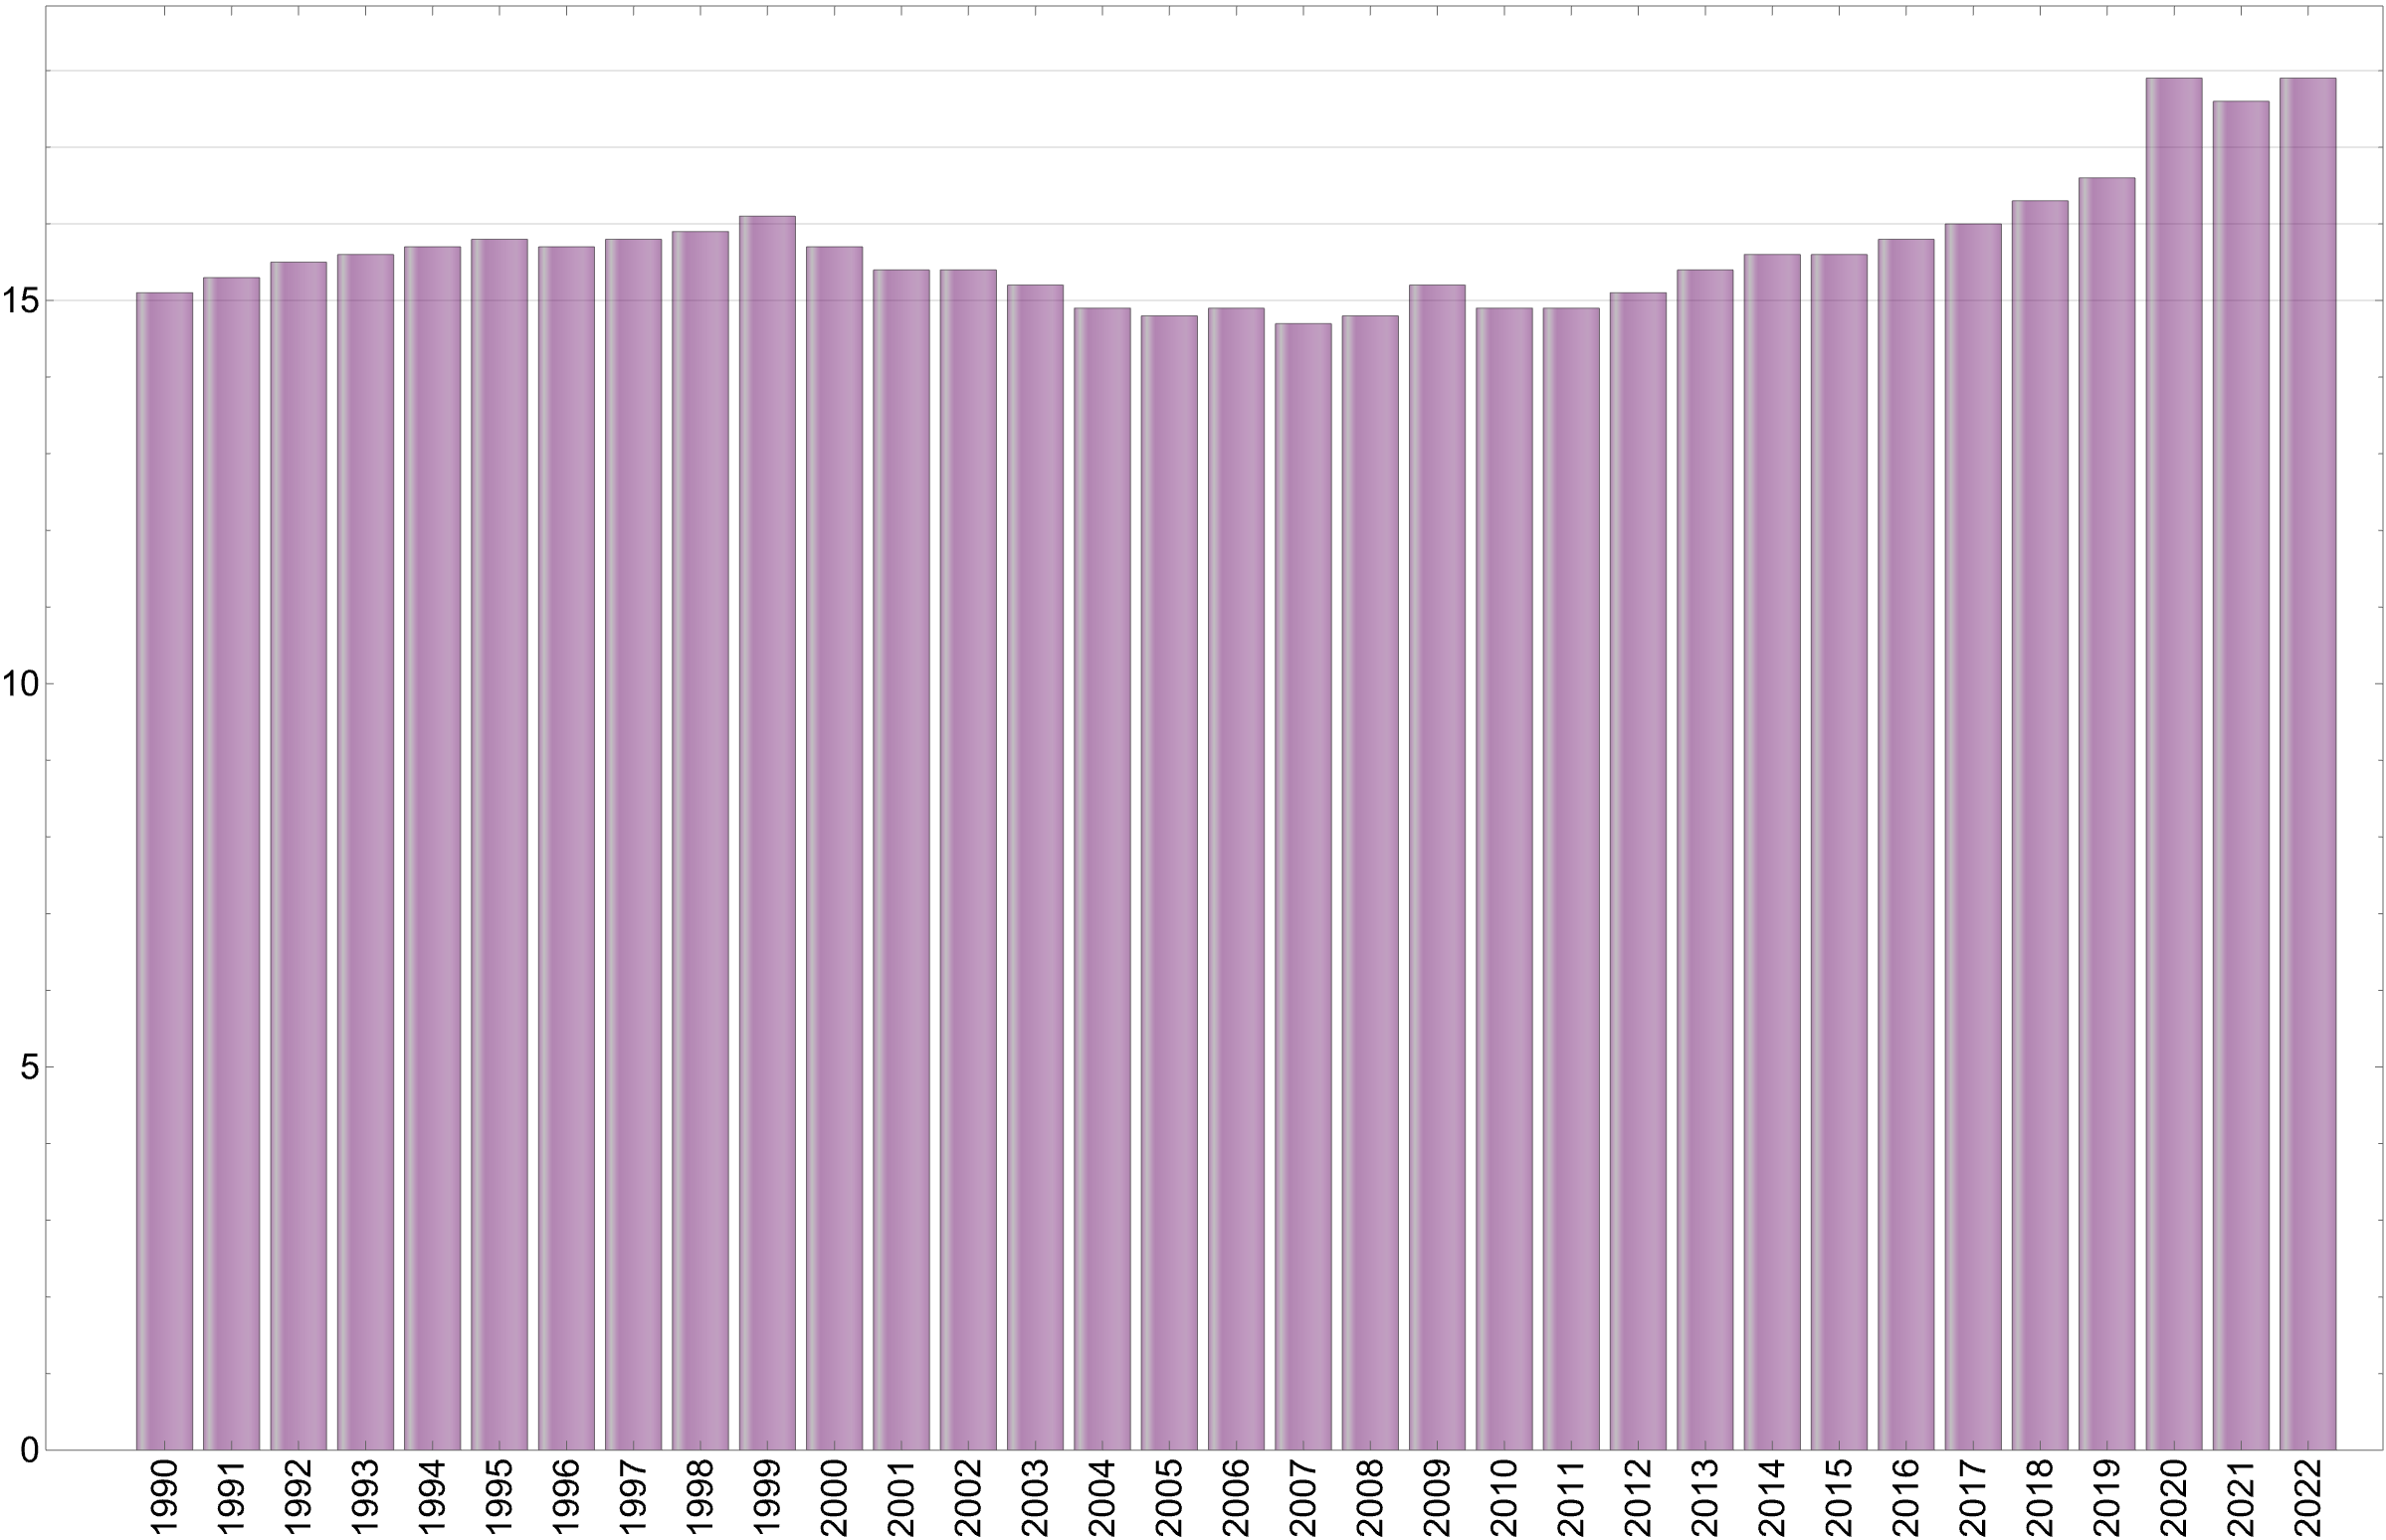
How much comes from renewables? In 2022, about 18%.
This metric, "renewable share of total final energy consumption" is an official SDG (Sustainable Development Goals) 7.2.1 indicator used by the United Nations and the World Bank.1, 2 It is not, however, widely discussed in popular media.
How to read it
Higher values indicate penetration of renewables into the whole energy system, not just the power-generation sector.
This isn't the same as energy produced, because a surprising amount of energy is wasted or unused: as much as 65% is lost in some way between production and application.3, 4 Energy systems make waste heat, lose power through transmission, lose energy to friction, and have inefficiencies in the conversion of energy to useful work.
Limitations
The UN and the World Bank regard hydro, wind, solar, geothermal, bioenergy, marine, and renewable waste as renewable energy.
While nuclear is included as an energy form, it's not counted as a renewable; it's seen as a distinct, non-renewable, non-carbon energy source, counted in this metric in the same group as fossil fuels.
Also, the very nature of the metric means that mitigation schemes like Carbon Capture and Storage (CCS) are not considered.
You can imagine a world with widespread adoption of nuclear energy and CCS in which the percentage of end-use renewables power is identical to today. (This tells us something about limitations of the SDG 7.2.1 metric, but nothing of the desirability of nuclear energy or carbon capture and storage.)
Interpretation
This chart bothers people.
It seems to indicate we've made very little progress. That isn't wrong: we have more-or-less passed 1.5o Celsius in warming, and we're now hoping to avoid 2o. Greenhouse gas emissions continue to rise.
The strongest objections to the chart come from people who are aware that the amount of power from solar and wind installations is growing very quickly. Many SweetLightning readers know that Britain has shut down all its coal plants, and coal-powered generation is falling off in many other areas. Likewise, the growing number of electric vehicles is taking inefficient heat engines off the road, and lowering emissions profoundly.
The best response to these objections: the true picture is nuanced.
The percentage renewables in our total energy consumption — again, just under 18% in 2022 — seems small, but remember that this isn't just power grids. It includes cars, airplanes, cargo ships, domestic and industrial heating and processes, milling lumber, roasting marshmallows ... in other words, everything humans do.
First off, since world power consumption is growing, to make any gains at all, renewables have to grow more rapidly than other forms of energy, and they are. Non-carbon forms of power in Europe have eclipsed fossil fuels.
Replacement of thermal fuels is the right approach to the problem: when fossil fuels apply energy through thermal means, they are very inefficient. The wasted energy we mentioned up above is cut drastically whenever fossil fuels are eliminated ... on TOP of the elimination of the greenhouse gas they produce. Not only do we save energy when we don't use an inefficient fuel; we also save the energy that would be used to create it. The multiplicative effects can be startling: small shifts from fossil fuels to electric energy can make big gains. See our case study that compares internal combustion vehicles to battery electric vehicles.
As we try to electrify everything, each time something electrical replaces something fossil-fuel-based, the energy needed for that particular application goes down. We get more efficient: small movements on this graphic mean significant gains.
The progress is there. You will see it in other measurements.
Reading
- United Nations Statistics Division. UN Energy Statistics Database. New York: United Nations. Accessed December 8, 2025. https://unstats.un.org/unsd/energystats/[1].
- 7.2.1 - SDG indicator metadata - the United Nations https://unstats.un.org/sdgs/metadata/files/Metadata-07-02-01.pdf.
- Slanger, Dan. “The Incredible Inefficiency of the Fossil Energy System.” RMI, June 4, 2024. https://rmi.org/the-incredible-inefficiency-of-the-fossil-energy-system/.
- United Nations Development Programme. World Energy Assessment: Energy and the Challenge of Sustainability. Chapter 6: Energy End-Use Efficiency. By Eberhard Jochem et al. New York: UNDP, 2000. Accessed January 1, 2026. https://www.undp.org/sites/g/files/zskgke326/files/publications/chapter6.
Audio version: