Efficiency - A Little Bit Goes a Long Way
Like comedian Rodney Dangerfield, energy efficiency "don't get no respect," but it deserves more policy attention and more widespread application.

I suspect that most people’s eyes glaze over when they hear the word efficiency, as it likely conjures up images of bespectacled, clipboard-carrying geeks in white lab coats, who watch your every move on an assembly line to see if the company can find ways to extract more work from you during your shift.
While narrowly true, that’s only one aspect of a much larger efficiency story. In engineering terms, efficiency is the amount of useful work output obtained from a given amount of energy input. The Second Law of Thermodynamics tells us that number is always less than 100%. How much less (and how those numbers have changed over time) is in some respects the history of the material progress of civilization.
Clearly, improving the efficiency of devices that do necessary civilizational work will reduce greenhouse gases (GHGs) when the primary energy sources are fossil fuels. You might think, for example, that a 10% improvement in efficiency in the end-use device you are using to do the work – a chainsaw, a vehicle motor, a heating system – will result in an equal 10% reduction in GHGs.
That’s sometimes true but it’s often much more, and there are a couple of reasons why.
One reason is the reduction in primary energy consumed and GHGs emitted depends very much on the efficiency of the technology in between the energy source and the final work. Every energy conversion and transport stage along the way injects its own inefficiency (Second Law), and those inefficiencies don’t add: they multiply or even cascade. That means that relatively small improvements in end-use efficiency can amplify primary energy and GHG reductions.
Another reason is that looking solely at percentages can be misleading.
Usually, we consider the efficiency of any energy conversion stage of a process by starting with the amount of energy we have and applying the efficiency percentage (which is the same as a decimal fraction, always less than 1.0, e.g. 90% = 0.9) to see how much energy we have left to apply to the next stage.
An alternative way of understanding efficiency’s importance is to reframe our perspective by asking instead how much additional energy is required to deliver every useful unit of work. If we start at the end-use of a process, take the amount of energy to do the end-use work, and invert the efficiency fraction, i.e. divide 0.9 into 1.0, so that 1.0 ÷ 0.9 = 1.11, we can see that to do one unit of end-use work using a process that is 90% efficient, we will need 1.11 – 1.0 = 0.11 additional units of energy. Looking at it this way, with inverted efficiency fractions, lower numbers mean greater efficiency.
OK, that's the theory: how does it work in practice?
In order to get a more visceral sense of the energy — and therefore GHG — reduction implications, let’s look at one example: the total energy needed for passenger vehicles, specifically battery electric vehicles (BEV) compared to internal combustion engine vehicles (ICEV). This example doesn’t include the GHGs generated by manufacturing, maintaining, and end-of-life disposal of either type of vehicle. Other studies have generally concluded that BEVs come out ahead of ICEVs when considered over their entire life cycle.1
Accounting for all the losses due to energy conversion and transport stages is generally characterized as “well-to-wheel” efficiency (WTW), and is often further broken down into “well-to-tank (WTT)” and “tank-to-wheel” (TTW) categories.2
The variations in vehicle types, engine types, electricity-grid generation types, and petroleum sources are many,3 so we’ll simplify our example to four illustrative cases (bearing in mind the numbers will be different for other cases):
- BEV using hydro-power electricity
- BEV using coal-fired electricity
- ICEV using gasoline derived from light sweet crude oil
- ICEV using gasoline derived from heavy sour crude oil (oil sands)
Assuming a base of one unit of useful work energy delivered at the wheel-to-road interface, we’ll consider several stages along the way needed to supply the additional energy to that single unit, moving upstream from the wheels back to the source, for each of our four cases. Each step has its own unique inefficiency, expressed here as a loss fraction (divide efficiency as a percent into 1), where lower numbers mean greater efficiency.
In reality each stage in each case doesn't have just one number but has a range of loss fractions depending on the specific vehicles, the generation mix of the electricity grid, and the source of crude petroleum. I’ve used numbers from the middle of the ranges.
We’ll start with the case of ICEVs burning either light or heavy crude.
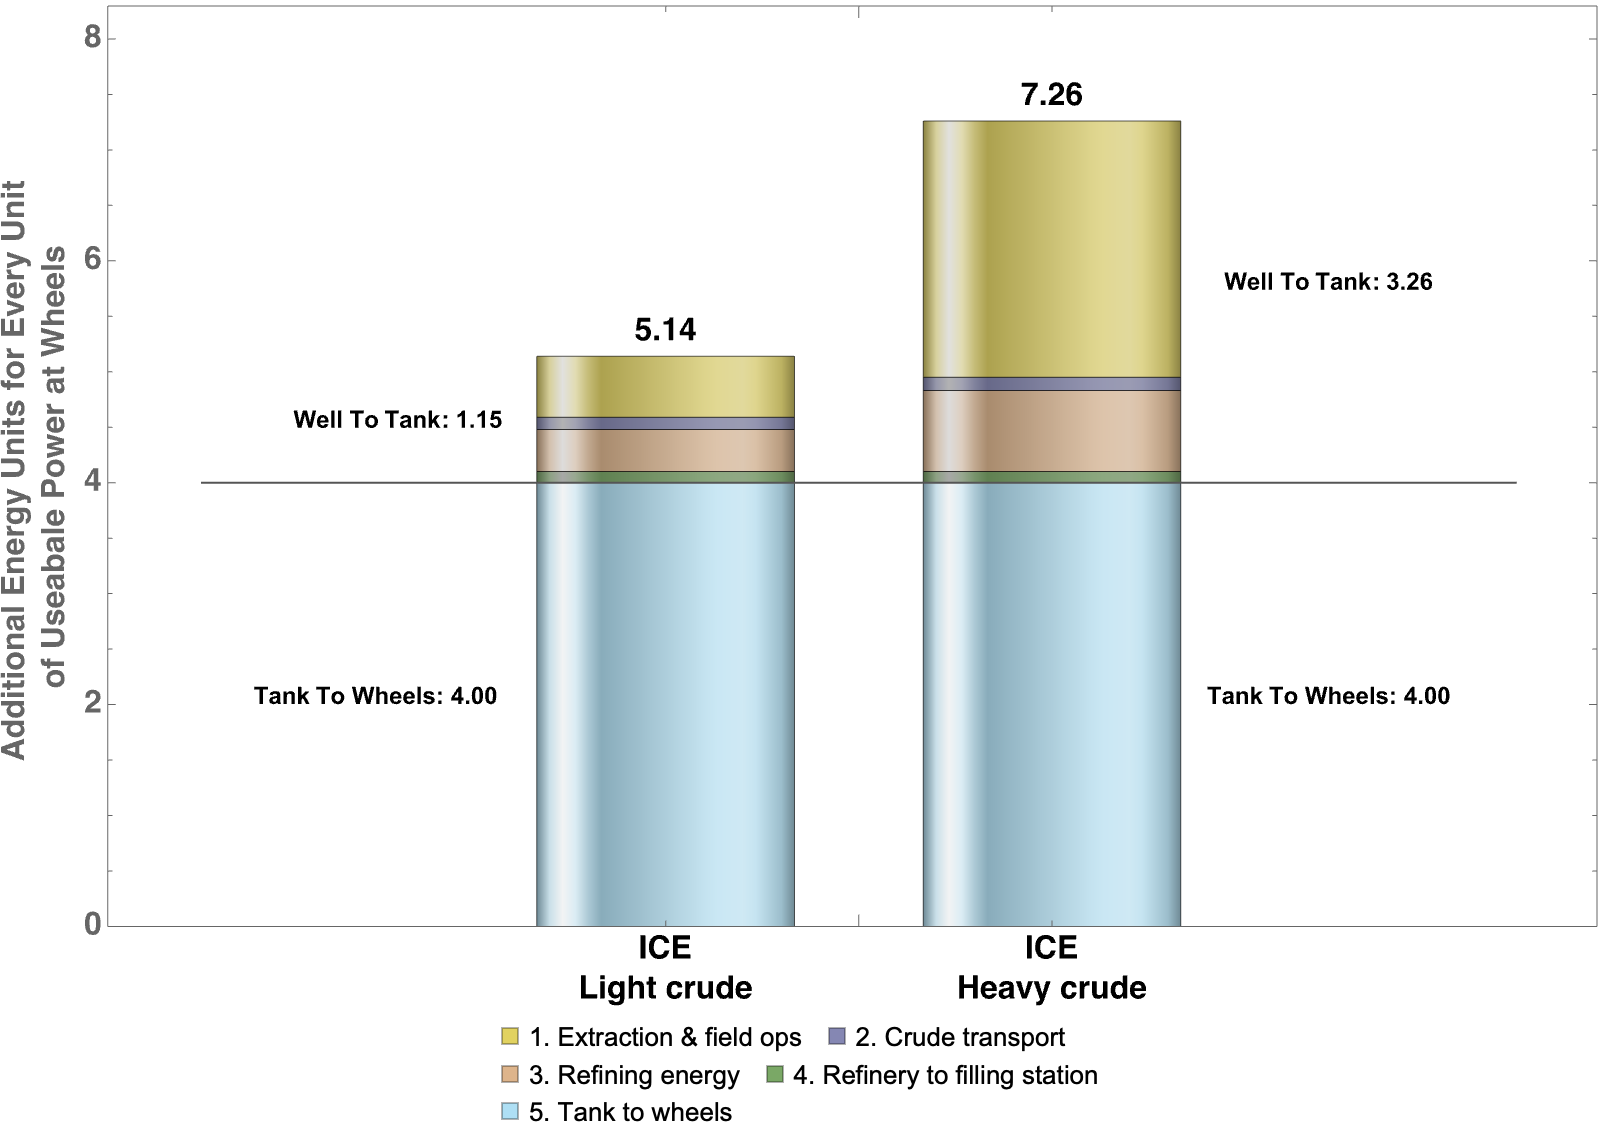
For this analysis of ICEVs, we’ll consider five stages that transform the primary source energy to work energy at the wheel: tank to wheel (ICEV motor drivetrain), refinery to filling station, refining energy, crude petroleum transport to refinery, and extraction/field operations.
(If you're viewing this in your browser, you can click the image to enlarge it.)
The first observation to note is the massive tank-to-wheel inefficiency of the internal combustion engine drive train (stage 5, in light blue). Every one unit of energy applied by the wheels to the road to move the vehicle requires four units of chemical energy in the form of gasoline in the tank. This is unavoidable due to thermodynamics, specifically as defined by something called "Carnot-cycle" efficiency of heat engines, which states nearly two thirds of the energy will be lost in a practical heat engine when converting chemical energy to heat energy. Also, road-transport engines rarely operate at their most efficient point, and part-load efficiency (at idle, very low, and very high speeds) is markedly worse.
The second observation is that the source of the gasoline makes a significant difference to the total well-to-wheel energy. Compared to light sweet (low-sulphur) crude oil, oil-sands-derived gasoline requires a lot more energy to scoop up from the ground and more energy to refine (stage 1: gold colour).
When you add up all the stages, the massive well-to-wheel inefficiency of fossil-fuel-powered transport becomes apparent. The best case requires over five units of additional fossil fuel energy just to deliver one unit to the wheels, while the worst case requires over seven units.
Now let's look at what happens if you replace the internal combustion drivetrain with an electric motor and battery.
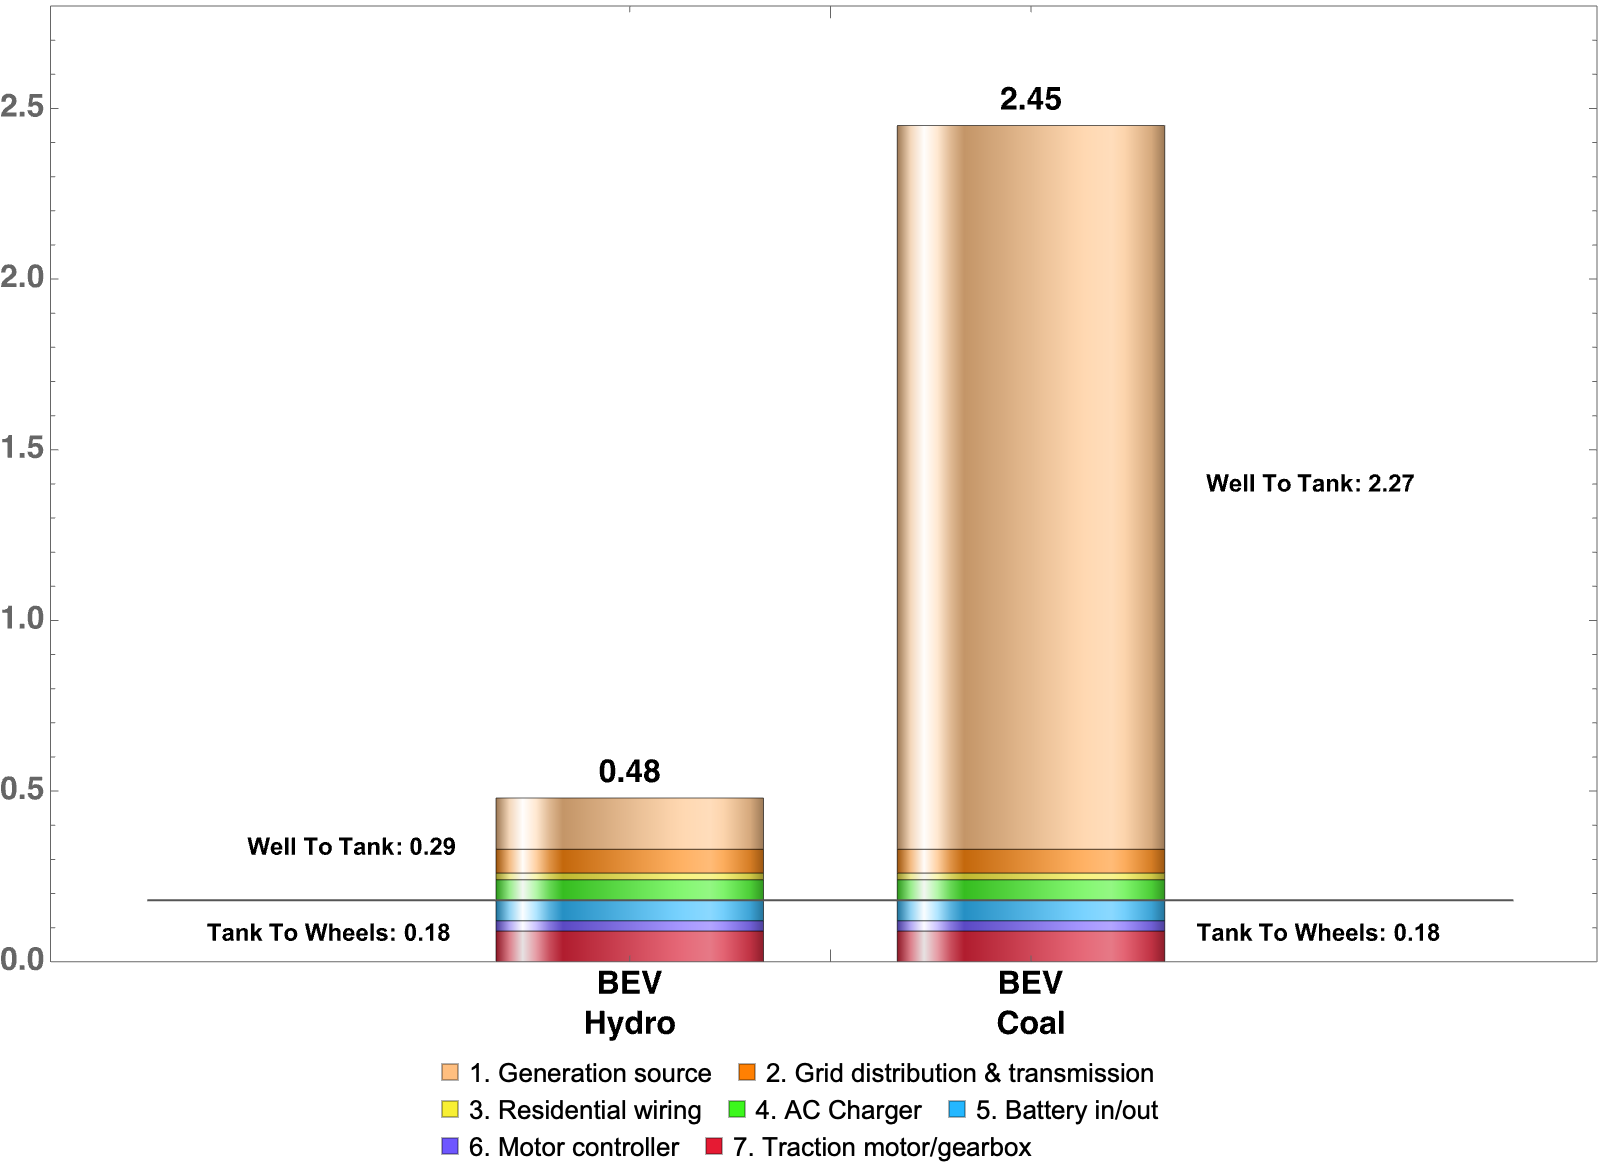
BEVs have seven stages: traction motor/gearbox, motor controller, battery, AC charger, residential wiring, electrical grid transmission and distribution, and electricity generation source. Here are the numbers for BEVs. Note that the scale is not the same as Figure 1; we wanted you to be able to see the small slices in proportion.
(If you're viewing this in your browser, you can click the image to enlarge it.)
Two observations from this chart stand out.
The first is what a massive reduction in overall primary energy results from replacing the ICEV tank-to-wheel technology (a heat engine subject to Carnot-cycle thermodynamics) with an electric motor, subject to the much-lower losses of electromagnetic laws. In the worst case of coal-fired electricity generation, electric motor propulsion requires less than one-tenth as much additional primary energy to deliver one unit to the wheel as the best case internal combustion drive train, and less than half as much in the worst case.
The second thing to note is the large inefficiency inherent in the case of coal-fired electrical generation plants (stage 1, copper colour). Again, this is thermodynamics, as coal power plants are Carnot-cycle heat engines, just like internal combustion engines, although they tend to operate closer to their optimum efficiency most of the time. Even so, less than half their primary energy gets converted to electricity, with the rest becoming heat.
How do these case examples relate to the effects of a given percentage improvement in efficiency of end-use energy mentioned at the beginning of the article? More importantly, how are greenhouse gas emissions affected?
First, here are all those bars side-by-side and at the same scale, so the magnitudes are easier to compare:
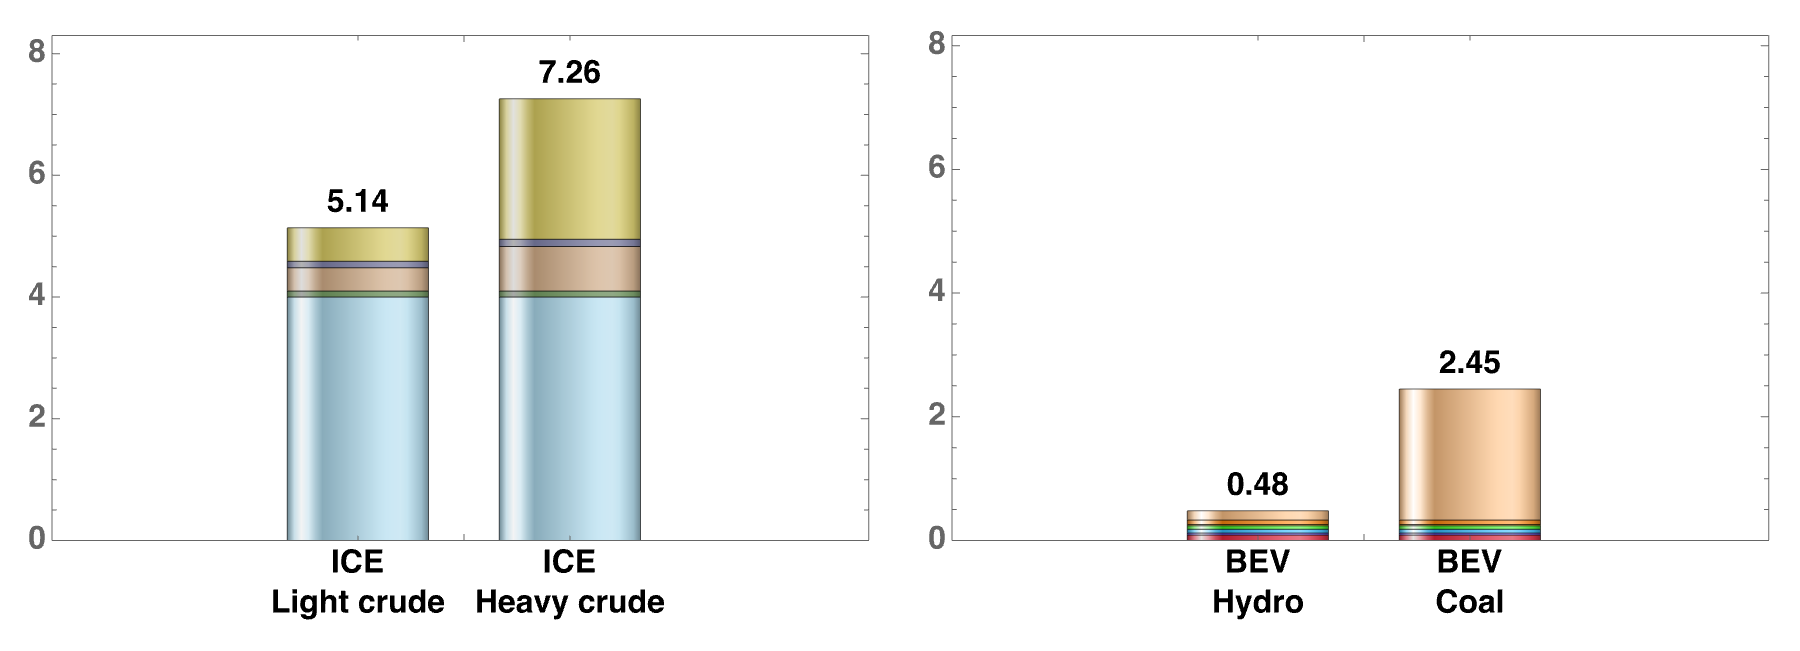
Let’s look at the most conservative comparison first, between the worst BEV (coal-fired electricity) case and the best ICEV (light crude) case. It's worth noting that differences in primary energy source consumption do not exactly equate to GHGs emissions reductions, but when the primary energy sources are both fossil fuels, the upstream GHG reductions are a similar order of magnitude, so efficiency-derived numbers are a reasonable proxy for GHGs.
First, the tank-to-wheel (end-use) efficiency of an ICEV (pale blue on the ICEV chart) is only about a quarter that of a BEV (stages 5, 6, and 7 added together: magenta+purple+blue on the BEV chart), meaning the BEV is about 4X more efficient. Counter-intuitively, however, the reduction in energy required at the tank or battery is much greater, going from 4.0 additional units down to only 0.18 additional units, a 22X improvement.
Second, taking into account inefficiencies in the upstream extraction and generation processes that deliver energy to the tank or battery, the overall well-to-wheel efficiency of an ICEV is about half that of a BEV, not nearly as impressive but still an improvement of 1.8X. In the overall case, the reduction in additional source energy goes from 5.15 units down to 2.45 units, a 2.1X improvement.
In the least conservative comparison, the differences are starker.
In the best BEV (hydro) and worst ICEV (heavy crude) cases, the greater differences are due to the primary sources being so different in their GHG emissions content. The overall well-to-wheel efficiency of an ICEV is about one fifth that of a BEV (i.e. more than a 5X improvement). The reduction in additional source energy (and GHG emissions) drops from 7.26 additional units down to 0.47 additional units, a 15X improvement.
We’ve looked at passenger vehicles, but similar improvements are possible wherever devices using electricity can replace heat engines that must convert fossil fuels to work, including heating systems,4 some heavy road transport,5 and railways. Electric motors for aircraft are not yet widely practical due to weight constraints, which limit battery capacity and therefore practical range. Range constraints also limit widespread electric motor/battery adoption in long-distance shipping.
Reading
- Veza, Ibham, Muhammad Zacky Asy’ari, M. Idris, Vorathin Epin, I. M. Rizwanul Fattah, and Martin Spraggon. “Electric Vehicle (EV) and Driving towards Sustainability: Comparison between EV, HEV, PHEV, and ICE Vehicles to Achieve Net Zero Emissions by 2050 from EV.” Alexandria Engineering Journal 82 (November 2023): 459–67. https://doi.org/10.1016/j.aej.2023.10.020.
- “Well-to-Wheels Analyses - The Joint Research Centre: EU Science Hub.” Accessed January 15, 2026. https://joint-research-centre.ec.europa.eu/welcome-jec-website/jec-activities/well-wheels-analyses_en.
- Albatayneh, Aiman, Mohammed Assaf, Dariusz Alterman, and Mustafa Jaradat. “Comparison of the Overall Energy Efficiency for Internal Combustion Engine Vehicles and Electric Vehicles.” Environmental and Climate Technologies 24 (October 2020): 669–80. https://doi.org/10.2478/rtuect-2020-00.
- https://www.sweetlightning.eco/efficiency-gains-via-electrification-or-why-we-should-electrify-everything-we-can/
- Liu, Xinyu, Amgad Elgowainy, Ram Vijayagopal, and Michael Wang. “Well-to-Wheels Analysis of Zero-Emission Plug-In Battery Electric Vehicle Technology for Medium- and Heavy-Duty Trucks.” Environmental Science & Technology 55, no. 1 (2021): 538–46. https://doi.org/10.1021/acs.est.0c02931.