The Business of Climate Change: A Solar Success Story
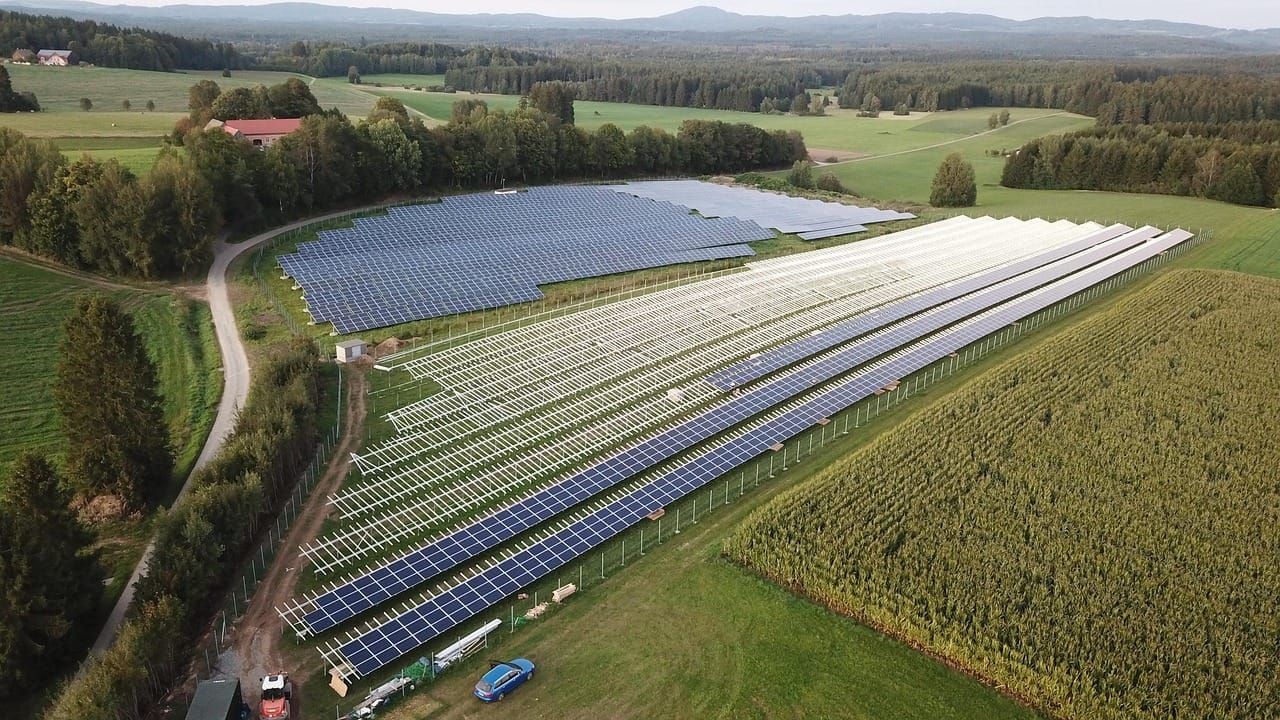
Solar power is here to stay
It may seem odd to talk about “success” in the context of climate change. After all, atmospheric GreenHouse Gases (GHG) continue to rise as does global warming. Some of our climate friends note that there is still so much to do. Surely it is too early to talk about success.
Over the last decade, solar power has gone from a niche curiosity to the world’s leading source of new electricity generation. In 2010, global installed solar capacity was around 40 gigawatts. By 2023, it had surpassed 1,400 gigawatts, and under current projections, that figure could more than triple by the end of this decade. Beginning in 2023, solar power accounted for 60% of new capacity globally and that is continuing to rise. 1
This isn’t just a “feel good” technology story, it is a solid business success based on research and innovation, leading to falling costs and ultimately to market success. The success of solar energy has not been driven solely by a need to find an energy source with lower greenhouse gas emissions, but rather by the market forces of good business decisions.
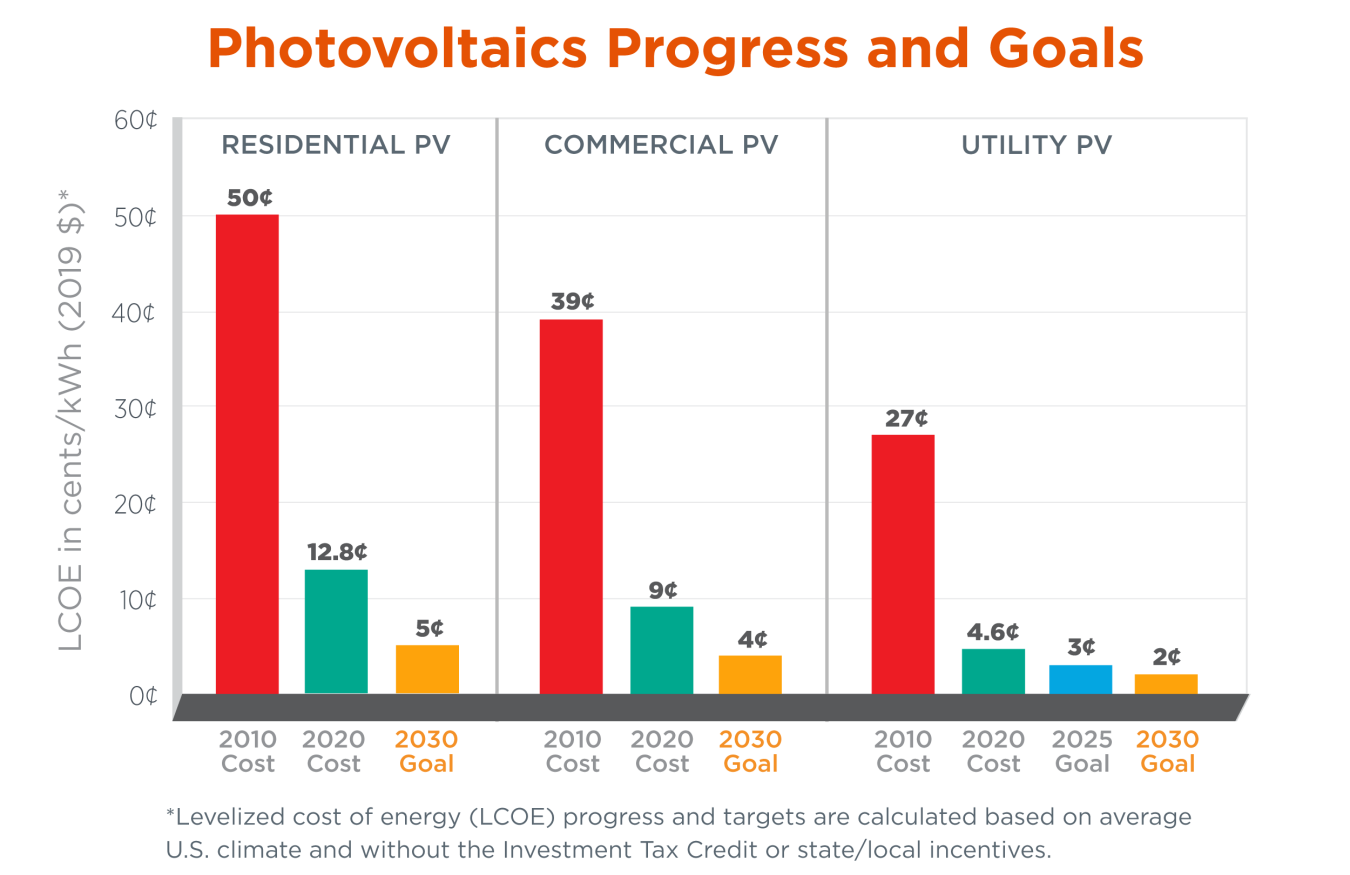
The price of solar panels has fallen by more than 90% since 2010. In most parts of the world, solar is now the cheapest form of new electricity generation. In 2023 alone, more solar capacity was added worldwide than coal, gas, and nuclear combined. In many cases, it has become the default choice for adding new power generation.2
This is a good moment to lean back in your chair and savour the feeling of success that comes from a job well done. ( If you have laurels in your chair, please don’t rest on them: we have more to do!)
While you are feeling the glow of success, let’s take a brief moment to talk about the “s-curve” that is often used to describe the adoption and growth of new technologies, systems, and behaviours. The s-curve (sigmoid curve) breaks down growth into 3 distinct phases that roughly create the shape of an “S” when plotted on a graph. The first phase, the bottom part of the “S”, is characterized by slow, sluggish growth, with technology that is new, expensive and unfamiliar: mostly used by early adopters. The second phase, the part of the S that goes up, is the inflection point to rapid growth, with dropping prices, growing awareness, and it maybe becomes “cool”. The third phase is maturity with slower growth as the market gets saturated. It becomes mainstream and a bit boring.
In order to make further progress on climate change we need more technologies to get on to this adoption curve. Some are still at a very early stage and not yet really on the s-curve: carbon capture and storage, green hydrogen, sustainable building materials, electric aviation, alternative proteins, and low carbon food, amongst others. Many of these will get there; they are just early.
Let’s talk for a minute about the next technology likely to enter phase two of the s-curve: electric vehicles (EVs). EVs have been around for a long time, with some weird and wonky developments along the way. Gradually, the main limitations of EVs are being overcome, with some recent developments now showing great promise and costs starting to come down. The main barrier to the adoption of EVs has been range anxiety, which translated into two parts: how far can I go on one charge and where and how long does it take to charge up?
The informal standard that EVs need to meet is that of existing internal combustion engine (ICE) vehicles. In general terms, this is a trip of 300-500 miles per fill up and about 5 minutes to refuel. Recent innovations, mainly out of China, have reportedly reached this level of parity. 3, 4 “Wright’s Law”, which is often used when talking about energy economics, postulates that cost falls by a fixed percentage for every doubling of cumulative production. For solar panels it was 20%. If this law works for batteries and charging, then we can reasonably assume that EVs will enter stage 2 of the “S-curve”. Already EVs make up 20% of global new car sales. 5
So where does all this leave us?
Hopefully, with a bit more clarity. We’ve seen what success can look like. Now we need more of it — in buildings, transport, materials, food, and finance. Solar shows that human systems can change. That industries can evolve. That the future is still, in part, a design project.
Now when someone suggests it can’t be done, we can say yes it can, because we’ve done it before.
Reading
- IEA. “Renewables 2023 – Analysis.” Accessed August 26, 2025. https://www.iea.org/reports/renewables-2023.
- U.S. Department of Energy, Solar Energy Technologies Office. 2023 Solar Energy Technologies Office (SETO) Highlights. Washington, D.C.: U.S. Department of Energy, 2023. https://www.energy.gov/eere/solar/solar-energy-technologies-office.
- Autoweek. “This Brand Now Promises Five-Minute EV Charging.” March 19, 2025. https://www.autoweek.com/news/a64229887/byd-megawatt-charging-system-blade-battery/.
- Carter, Tom. “Chinese EV Battery Maker CATL Launches 2nd-Gen Battery, Says It Can Add over 300 Miles of Range in Just Minutes.” Business Insider. Accessed August 26, 2025. https://www.businessinsider.com/catl-takes-on-byd-tesla-with-fast-charging-ev-battery-2025-4.
- International Energy Agency. Global EV Outlook 2024: Catching Up and Accelerating. Paris: IEA, 2024. https://www.iea.org/reports/global-ev-outlook-2024.